
Part:BBa_J364007:Experience
This experience page is provided so that any user may enter their experience using this part.
Please enter
how you used this part and how it worked out.
Applications of BBa_J364007
User Reviews
Lethbridge_HS iGEM 2019
Our team utilized this part to characterize the therapeutic portion of our CRISPR Cas13a system. In brief, we designed CRISPR RNAs (crRNA) to target a portion of the GFP mRNA transcript that interact with four different Cas13a proteins from four organisms. In theory, we had hoped that all three plasmids (GFP, crRNA, and Cas13a) would be transformed into E. coli Rosetta(DE3) cells to determine if we could have specific targeting of GFP in vivo . While we were unable to get our triple plasmid transformation to work, we were able to add characterization data related to the growth and fluorescence of GFP in E. coli DH5α cells, and in a dual plasmid transformation into E. coli BL21(DE3) cells with GFP and the crRNA plasmid. We continued to work with GFP in the plasmid pSB1C3.
Initially, we worked on characterizing how GFP is able to grow independently. Our team wanted to create a standardized fluorescence curves for GFP as well as a standardized growth curve for the E. coli DH5α cells expressing it. Then, when it came time to conduct our in vivo fluorescence assay, these curves would prove to be useful references for comparison with our results. We pipetted biological replicates of GFP into a 96 well plate, then used a spectrophotometer to observe optical density over time, and also a spectrometer to observe fluorescence over time. Figure 1 showed what we had expected the growth to be with an increase in doubling time likely due to the load placed on the cell from expressing the plasmid. Figure 1 showed what we had expected the growth to be with an increase in doubling time likely due to the load placed on the cell based on the plasmid. However, further attempts at replicating this data have been unsuccessful (figure 2). We are uncertain as to the cause of this issue. We suspect that by using overnight cultures, the fluorescent protein may already be matured and thus we did not get reliable fluorescence data or the protein did not fold properly in vivo .
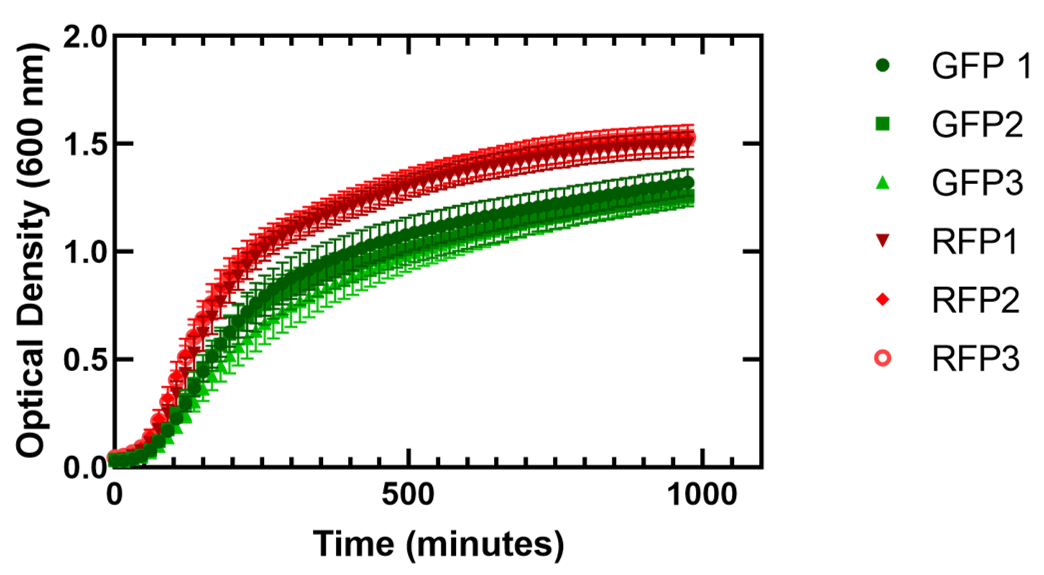
Figure 1. Growth of Escherichia coli DH5α cells containing GFP or RFP. Three biological replicates for each fluorescent protein and seven technical replicates were completed. Shown are all replicates averaged together and the standard deviation. The E. coli cells expressing GFP showed an average doubling time varying from 38.2 +/- 0.9 minutes to 41.8 +/- 1.6 minutes and for cells expressing RFP the average doubling time varied from 37.8 +/- 0.2 minutes to 41.0 +/- 0.5 minutes.
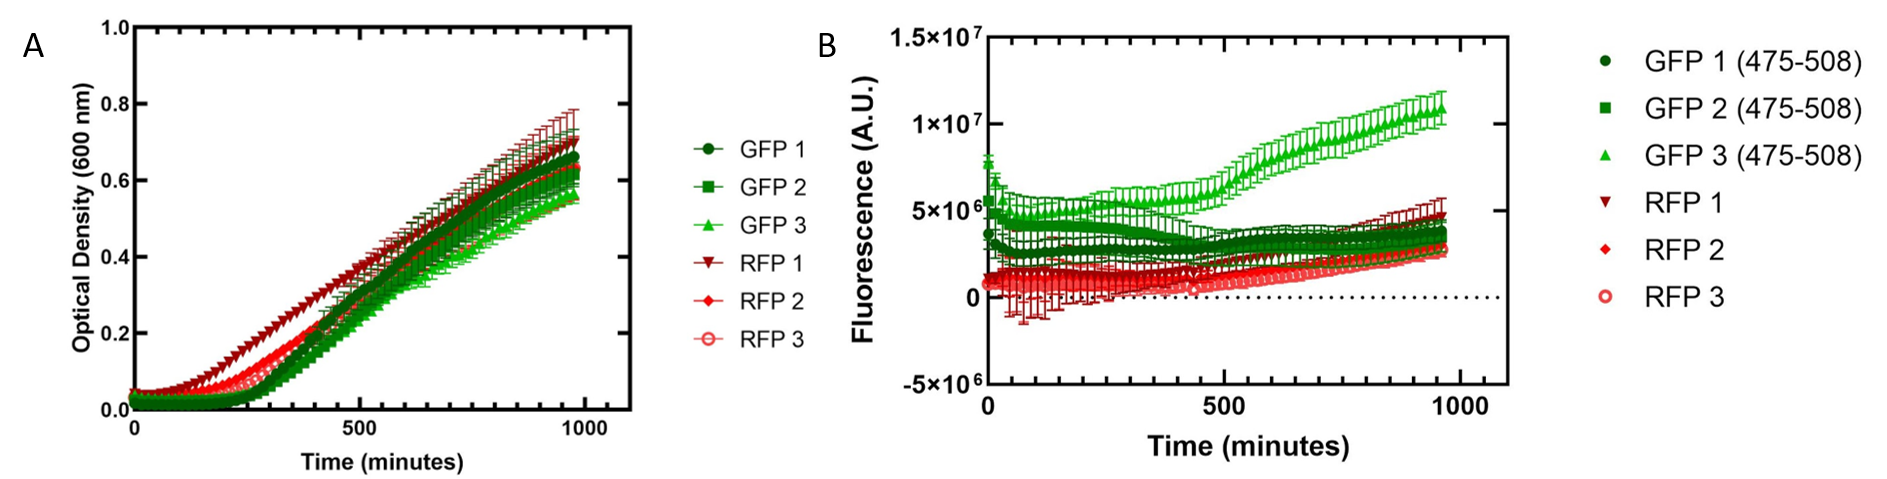
Figure 2. Growth of Escherichia coli DH5α cells containing GFP or RFP. Three biological replicates for each fluorescent protein and five technical replicates were completed. Shown are the average technical replicates and the standard deviation. (A) Optical density of E. coli cells expressing GFP or RFP with absorbance measured at 600 nm. (B) Fluorescence of E. coli cells expressing GFP or RFP. GFP excitation was measured at 475 nm and emission at 508 nm. RFP excitation was measured at 558 nm and emission at 583 nm.
Figure 3 shows a co-culture assay with a 1:1 ratio of GFP and RFP expressed in E. coli . We wanted to see if one culture of fluorescent protein would outcompete the other present. As with the single cultures shown in figure 2, the cells replicated slowly. Our fluorescence data indicated that the GFP we are using is more fluorescent than RFP. The fluorescence of RFP also showed greater variation, indicating that the RFP may not be folding properly to be excited in all replicates.
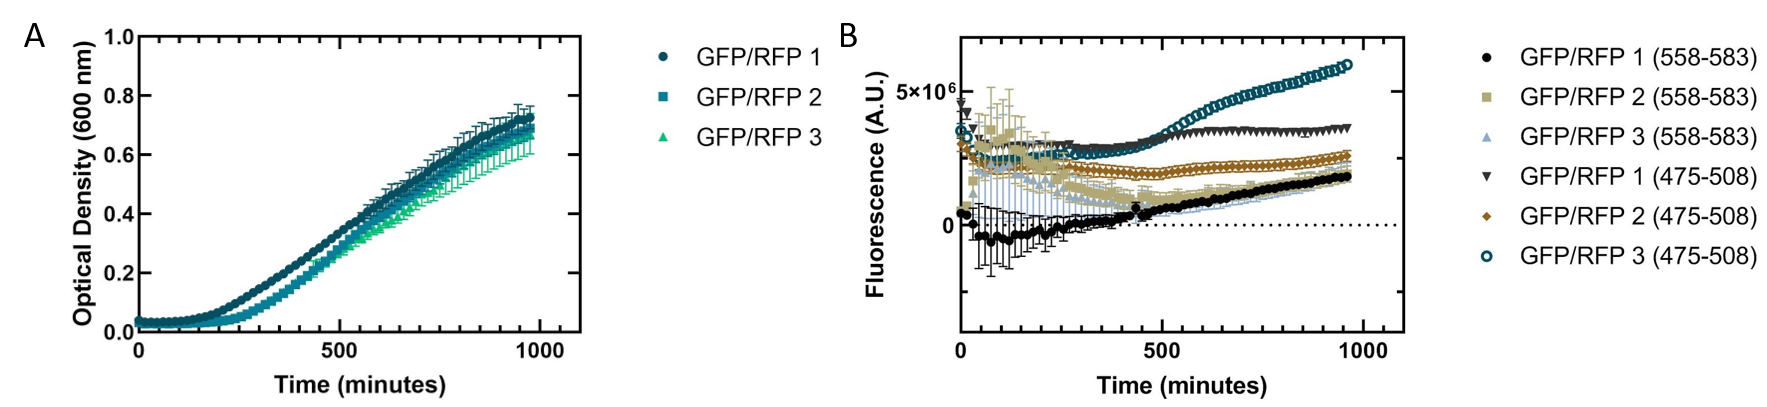
Figure 3. Co-culture of Escherichia coli DH5α cells containing GFP or RFP. Equal amounts of each cell type were added into a 96 well plate and grown together to see how they would grow in tandem. Three biological replicates for each fluorescent protein and six technical replicates were completed. Shown are all replicates averaged together and the standard deviation. (A) Optical density of E. coli cells expressing GFP or RFP with absorbance measured at 600 nm. (B) Fluorescence of E. coli cells expressing GFP or RFP. GFP excitation was measured at 475 nm and emission at 508 nm. RFP excitation was measured at 558 nm and emission at 583 nm.
We completed a dual plasmid transformation. To confirm that we had both plasmids present we completed a digest test because PCR amplification from the colony was not working. This should separate our construct from the plasmid confirming that both parts are present. In figure 4, only linearized cuts are seen near the 3000 bp mark. Due to both plasmids being approximately the same size it is difficult to see. However, there are two bands present. The second band at approximately 2000 bp is plasmid backbone, while the 1000 bp mark is the GFP insert. The crRNA insert (expected size is ~260 bp) is likely not seen in the gel due to having to run the gel longer to get better resolution for the upper bands.
Initially, our team had planned on doing a triple plasmid transformation of our target fluorescent protein (GFP), crRNA, and Cas13a to test if our system would work in vivo . We were unsuccessful in getting all three plasmids to transform, but did succeed in getting the fluorescent proteins and crRNA containing plasmids to transform together as seen in figure 4.

Figure 4. 1% agarose of restriction digests using PstI and EcoRI from Escherichia coli BL21(DE3) cells containing plasmids for GFP and Lbu crRNA, Lwa crRNA, Lba crRNA, or Lsh crRNA. Left to right: lane 1: Lwa crRNA colony 1; lane 2: Lwa crRNA colony 2; lane 3: Lwa crRNA colony 3; lane 4: Lwa crRNA colony 4; lane 5: Lsh crRNA colony 2; lane 6: Lba crRNA colony 1; lane 7: Lba crRNA colony 2; lane 8: Lba crRNA colony 3; lane 9: Lbu crRNA colony 1; lane 10: Lbu crRNA colony 2; lane 11: Lbu crRNA colony 3; lane 12: Lbu crRNA colony 4; lane 13: 1 kb ladder.
As an alternative experiment, our team grew cells that expressed the Lbu and Lwa Cas13a protein overnight. We also grew cells that expressed dual plasmids; GFP and crRNA Lwa; GFP and crRNA Lbu; RFP and crRNA Lwa; and RFP and crRNA Lbu. We then lysed the cells that expressed the Cas13a proteins using a French Press and clarified the lysate via centrifugation. Following this, our team pipetted in a 1:1 ratio of clarified cell lysate: fluorescent protein and crRNA into a 96 well plate. This allowed us to observe if there would be an effect from the CRISPR Cas13a system on the fluorescent proteins. We observed that in our optical density data, both dual plasmid systems for GFP and RFP had stunted growth in comparison to only E. coli cells expressing GFP or RFP or no plasmid (Figure 4C). Adding the lysate may have caused the death of the culture. We neglected to include replicates of the dual plasmid system without adding lysate to observe how that grew. This would be beneficial for any future experiments. Alternatively, there may have been some effect of the protein in the lysate on the GFP fluorescence (Figure 5B). However, we are unsure of the specificity due to the potential of the RFP not folding correctly in vivo as demonstrated by the substantial standard deviation seen in our replicates (Figure 5A).
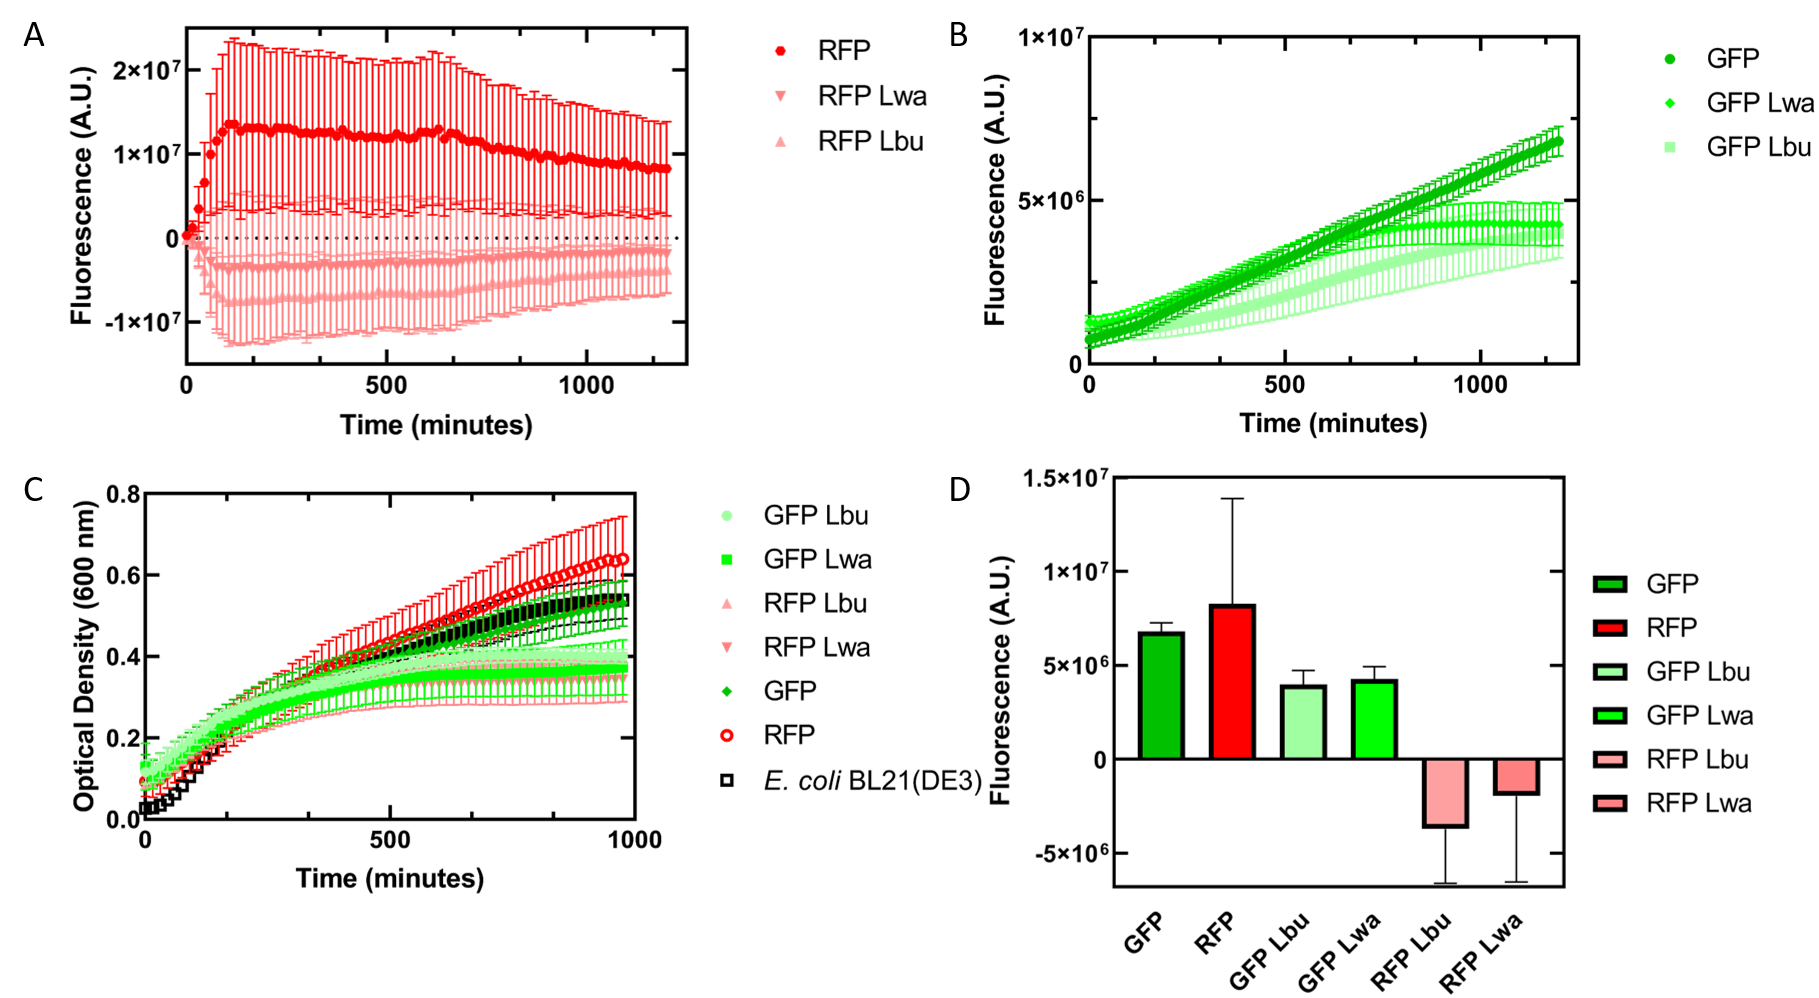 Figure 5. In vivo fluorescence assay of E. coli BL21(DE3) cells containing fluorescent protein and crRNA plasmids and E. coli Rosetta(DE3) cell lysate of overexpressed Cas13a proteins. This assay was conducted with 3 biological replicates and 3 technical replicates. (A) Fluorescence of E. coli cells containing only an RFP expressing plasmid, or dual plasmid expression of RFP and crRNAs from Lwa and Lbu that target GFP and the respective cell lysate containing the appropriate Cas13a. RFP excitation was at 558 nm and emission at 583 nm. (B) Fluorescence of E. coli cells containing only a GFP expressing plasmid, or dual plasmid expression of GFP and crRNAs from Lwa and Lbu that target GFP and the respective cell lysate containing the appropriate Cas13a. GFP excitation was at 475 nm and emission at 508 nm. (C) Optical density of E. coli cells expressing GFP, RFP, dual plasmid systems mentioned previously, or only E. coli BL21(DE3) cells with absorbance measured at 600 nm. (D) Relative fluorescence at maximum excitation at 81 minutes. GFP excitation was at 475 nm and emission at 508 nm and RFP excitation was at 558 nm and emission at 583 nm.
UNIQc3d9d7240efea47d-partinfo-00000000-QINU UNIQc3d9d7240efea47d-partinfo-00000001-QINU